2017 Mycorrhizal Mushroom Map:
1 Year, 1 Yard, 499 Mushrooms

Inocybe rimosa was the most prolific mycorrhizal mushroom in my yard last year, producing 353 mushrooms. It is a medium-sized brown mushroom with a conical cap, medium-brown spores, and an unpleasant odor.
In October of 2016, I stepped out into my back yard and found it carpeted with medium-sized brown mushrooms. Apparently, I had nothing better to do that day than attempt to identify these boring nondescript mushrooms, so I sat down with a field guide and managed to key them out to Inocybe rimosa.
This was a surprising result; most of the boring brown mushrooms that pop up in yards are saprobic, but Inocybe is a mycorrhizal genus. Since I. rimosa is mycorrhizal, there is only a very limited area in my yard that it can grow. This made me wonder, “Will it grow in the same place next year?” There was only one way to answer that question: keep track of where mushrooms appear in my yard. I logged all 227 I. rimosa mushrooms and waited eagerly for 2017, when I would map all the mycorrhizal mushrooms that appeared.
Unique Ecological Opportunities
Surprisingly, suburbia is the perfect location to study mycorrhizal mushrooms. Take my yard for example. There are lots of different tree species bordering my back yard. Counterclockwise from the western edge, they are: a Japanese bush honeysuckle, two dogwoods, an eastern redbud, a southern magnolia, a few Leyland cypress trees, a willow oak, a row of ornamental shrubs interspersed with a few crepe myrtle trees, and finally a zelkova. The exciting thing about this lineup is that only the willow oak is ectomycorrhizal.
There are two basic types of mycorrhizas: ectomycorrhizas (see FFF#075) and arbuscular mycorrhizas (see FFF#074). Most plants use arbuscular mycorrhizas and partner with fungi in the Glomeromycota. Those fungi are ubiquitous but mostly invisible because they do not produce mushrooms. Mushroom-forming fungi form only ectomycorrhizas, so they partner with relatively few plants. Since there is only one ectomycorrhizal tree in my yard, all the mycorrhizal mushrooms must be associated with that tree.
Farther away, there is a paper birch and a different species of oak tree, which could impact the mycorrhizal mushrooms near the northeastern and southeastern corners of my map. All of the mushrooms on my map seem to be centered on my willow oak, suggesting they are mycorrhizal with that tree and not one of the others. The Scleroderma bovista in the northeastern corner of the map is the only one I think could be associated with one of these other trees.
This situation is ideal for studying mushrooms, since you can tell which tree is hosting the fungus and how far the fungus is from its host tree. You might find a greater diversity of mushrooms in a forest, but it is usually impossible to say for certain which tree is associated with which mushroom because more often than not there are multiple potential host trees nearby.
Suburbia solves this problem by reducing the number of trees and increasing the distance between trees of the same species. This is done for aesthetic effect, but provides a valuable opportunity to study how mycorrhizal mushrooms behave in relation to their host tree and in relation to one another.
My tree, the willow oak, has a diameter at breast height of 1.51m. Diameter at breast height (DBH) is the standard way of measuring the size of a tree, since it’s easier to measure a tree’s base than its height (especially when you’re in a forest). In the United States, DBH is measured 4.5ft above ground level. To measure it, just wrap a tape measure around the tree 4.5ft above the ground and divide that measurement by pi (3.14159…).
This means the tree is medium-sized, as oaks go. It was planted around 20 years ago, but was in a nursery for some time before that. Tree size and age are important because they may impact the types of mushrooms that associate with the tree. The full extent of this impact probably isn’t known; collecting records of which mushrooms appear under which trees over a long period of time will help create a fuller picture of how the mycorrhizal community responds to changes in trees as they age.
General Observations
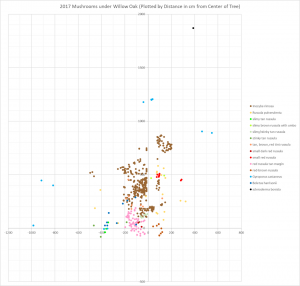
When you look at the 2017 map, the first thing you notice is that areas tend to be dominated by a single mushroom species. Inocybe rimosa and the red Russula with a tan margin are the best examples of this. Few other species appear inside the areas dominated by those two mushrooms and there is very little overlap between I. rimosa and that Russula.
This is not an unexpected result. Consider how saprobic mushrooms behave in a decaying log: when two fungi encounter each other, they build a dense wall of proteins at the point of contact to prevent the other fungus from invading their territory. If you cut open a log, you can see these walls as black lines that snake through the wood. It is not surprising, then, that mycorrhizal mushrooms also dominate areas under a tree and exclude other species.
Since I. rimosa and the red Russula with a tan margin have such a well-defined border, they probably interact with the tree in an identical manner. Most likely, these two species provide the tree with the same ratios of nutrients in exchange for the same proportion of sugars. Because of this similarity, neither would be competitive in the other’s territory. Think of it this way: if two companies provide the same services for the same price, customers will stay loyal to whichever company is in their area and neither company will gain or lose customers to the other. Of course, this model assumes the border between the two mushrooms will be stable over time. I don’t have data on the Russula from 2016, so I will have to wait until summer to test this idea.
The most interesting parts of the map are the areas where certain species are not excluded. Consider Boletus harrisonii: it appeared in a V-shaped pattern with one end of the V cutting into the heart of Inocybe rimosa territory and the other end crossing over the area dominated by the red Russula with a tan margin.
Why is B. harrisonii allowed access to these territories? Probably because it exploits a slightly different ecological niche than the other two mushrooms. If B. harrisonii supplies the tree with a slightly different mix of nutrients and/or accepts a different amount of sugars in return, then it might be able to compete with the other two species for access to tree roots. In the business analogy, one company can steal customers from another by offering slightly different services at slightly different prices.
B. harrisonii overlaps significantly with the other two mushrooms, which could indicate that it isn’t directly competing with those fungi. Perhaps B. harrisonii provides the tree with certain nutrients that I. rimosa and the red Russula with a tan margin cannot and vice versa. In that situation, the tree needs B. harrisonii as well as I. rimosa or the Russula, meaning the other two mushrooms will have to tolerate the bolete to provide the tree with everything it needs.
Of course, my map cannot explain how B. harrisonii behaves differently. To do that you would have to carry out a detailed scientific study comparing the rates of nutrient exchange in B. harrisonii mycorrhizas to mycorrhizas formed by I. rimosa or the red Russula with a tan margin.
 Diversity
In 2017, I counted 14 different mycorrhizal species fruiting underneath my willow oak. Ten of those were russulas, two were boletes, one was an Inocybe, and the other was a Scleroderma. It amazes me that so many species of Russula can survive in such a small area. This is particularly impressive when you realize that every other genus appearing in my yard is represented by a single species. Why are russulas able to coexist with one another better than mushrooms from other genera? Your guess is as good as mine.
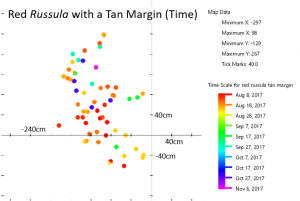
I became quite familiar with two species of Russula during the course of the year. One of these was an unidentifiable species that I dubbed “red Russula with a tan margin.” It appeared 59 times throughout the year in a small area, so I had multiple opportunities to assess its features. I am confident that those 59 mushrooms belong to the same species (whatever that is). Consider the time map for the red Russula with a tan margin; there aren’t any noticeable divisions within the group and the mushrooms appear to fruit randomly, so there’s nothing on the map to suggest that I might have included another species in this group.
The other species that became familiar was Russula pulverulenta, which appeared 17 times. It is a distinctive mushroom with a yellow cap, yellowish stipe, and a yellow powdery coating over its cap and stipe when young. These features are very distinctive, so the mushroom was easy to spot after I saw it the first few times.
I grouped the remaining 50 Russula mushrooms into morphological and spatial groups as best I could. These groups should roughly correspond to species, which is how I decided that my yard had ten distinct Russula species. Actually, I suspect that I underestimated the number of russulas. Most were small nondescript reddish or brownish species that I couldn’t identify and appeared only once or twice, so I had to lump them together.
Some of these groups have only a few mushrooms collected months apart, such as “slimy brown/tan Russula (with umbo).” That group consists of two mushrooms, one of which appeared in mid-summer and the other of which appeared in late fall. Both had a gelatinous pileus and lacked an odor, but the earlier one was darker and the later one had a distinct umbo. Color and presence of an umbo can vary with age and weather, so I lumped the two mushrooms together to make the map easier to read.
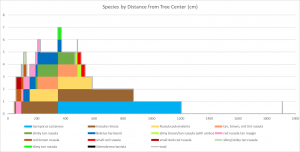
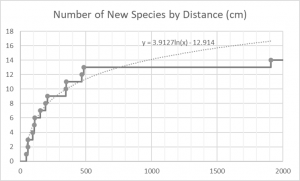
- The rate at which you encounter new species decreases as you get farther away from the tree.
On the other hand, there were times when I split morphologically similar species into different groups. The group called “tan brown red tint Russula” consists of mushrooms that look nearly identical to the red Russula with a tan margin but tended to be larger, fruit farther away from the tree, and have more variable colors. This could represent natural variation of the red Russula with a tan margin.
On the whole, I think I lumped different species into groups more often than I split the same species into multiple groups. Consequently, I believe ten is a conservative estimate of the number of Russula species that appeared in my yard.
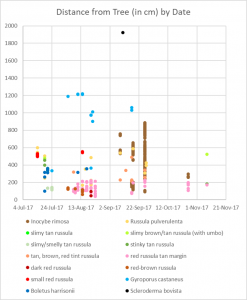
By counting the number of species present as you move away from the tree, you find that there are four distances where diversity peaks: 1.19m (5 species), 2.16m (6 species), 3.60m (7 species), 4.84m (6 species). The first two peaks are a result of the overlap between mushroom species that fruit close to the tree and those that fruit farther away.
The third peak is the most significant; half of the mushrooms I found had ranges that crossed this point and all but three species produced at least one mushroom before this point. Interestingly, 3.60m is almost exactly half the distance between the center of the tree and its farthest branches, which I measured to be 7.04m. This has a couple important implications. First, if you want to get a representative sample of a tree’s mycorrhizal community – either by counting mushrooms or by taking soil samples – your time would be best spent sampling well within the tree’s dripline. Second, and perhaps more useful to mushroom hunters, a mushroom’s host tree is probably the closest tree that forms branches above the mushroom. This insight will be useful the next time you’re out in the woods trying to decide which tree a mushroom is growing under. Of course, I’m drawing these broad conclusions based on a very limited data set containing a mere handful of mushroom species and only one tree species. To really see whether the same rules apply to mycorrhizal mushrooms in general, I would need data from more than just my own yard.
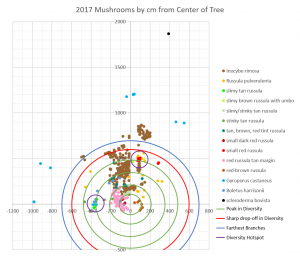 The third and fourth peaks in diversity correspond to two diversity hotspots on the map. One of these hotspots lies just to the west of the tree at 3.60m and the other lies a bit to the east of the map’s north-south axis at 4.84m. Both are easily visible because they have a tight cluster of mushrooms from at least three different species. Neither hotspot area looks very interesting aboveground; they are both grass-covered patches of lawn that look exactly the same as the rest of the lawn. What is causing these hotspots? I have no idea. Will the hotspots reappear in the same place this year? I’ll have to wait and see!
Seasonality
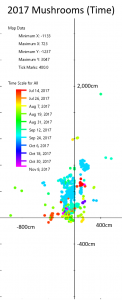
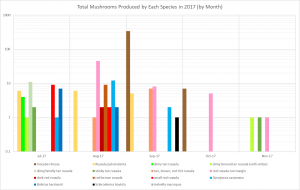
Different colors represent the days when mushrooms appeared. Rain and type of species appear to be the most important factors in deciding when mushrooms fruit.
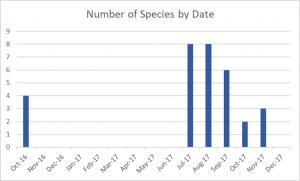
My map is not very interesting when you examine when the mushrooms appeared. All the mushrooms appeared in the summer and fall, which is what we expect from mycorrhizal mushrooms. Mushrooms of the same species tended to appear at the same time, but there weren’t any patterns of when or where mushrooms appeared when you look between species. So the season and rain are important, but ultimately it is up to the mushroom species to decide when it fruits. This isn’t surprising, but it’s good to know that these mushrooms are behaving as expected.
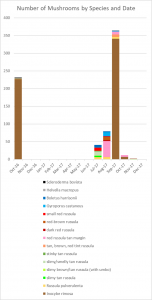
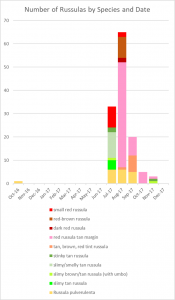
The main factor in when the mushrooms fruited seemed to be rain (again, as expected). August was fairly wet last year, and mushrooms reliably appeared after each rainstorm. October, on the other hand, was bone dry and very few mushrooms fruited during that month. I. rimosa demonstrates this point well; in 2016, that species produced over 200 mushrooms in October, but in 2017 it produced most of its mushrooms in September. Each species seemed to pick one of two strategies for producing mushrooms: it either produced lots of mushrooms all at once, like I. rimosa, or it produced a few mushrooms sporadically throughout its growing season, like the red Russula with a tan margin.
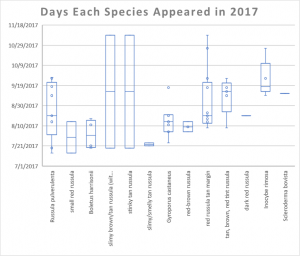
One thing that you can see is that the mushrooms labeled “slimy brown/tan Russula (with umbo)” and “stinky tan Russula” both appeared twice: once in July and once in November. This is an unusually large gap, which could indicate that the four mushrooms represent four different species. Ultimately, this unusual behavior is a reflection of the fact that I have very little data on these species.
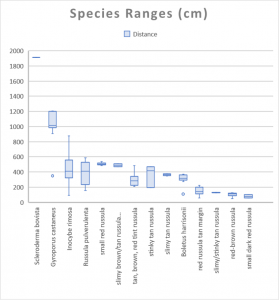
- In this chart, days when mushrooms appeared are represented by circles and by the minimum and maximum marks. The boxes represent 25%-50% and 50%-75% of the range (weighted). Small boxes and small lines mean the mushrooms appeared multiple times in quick succession over that quarter of the period.
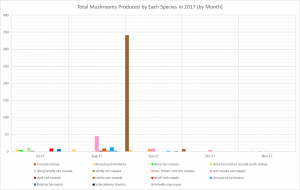
- I. rimosa produced so many mushrooms that it’s hard to see when the other species fruited on the previous graph. This graph displays the same data on a logarithmic scale, making it easier to see all the species.
Inocybe rimosa
I. rimosa was the most prolific mushroom in my yard last year. That species alone produced 353 mushrooms, pushing up 327 within a two-week period in mid-September. It first appeared on September 9 and produced four flushes of mushrooms through October 26.
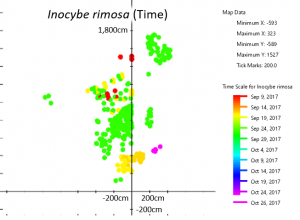
Different patches of I. rimosa appeared at different times, suggesting they arose from separate mycelia.
Based on their distribution on the map, differences in timing, and slight differences in color, I estimate that there are at between eight and fourteen individuals of I. rimosa in my yard. These are easiest to see in the time map of I. rimosa. Different patches of I. rimosa appear at different times, suggesting that they belong to different mycelia. If they were part of the same mycelium, they should either have appeared at the same time or have appeared multiple times evenly across the patch.
Take the patch in the upper right-hand corner as an example. This patch is physically separated from the rest of the mushrooms and all the mushrooms in that patch appeared at the same time. The yellow/orange patch near the bottom is less clear; the two areas are intertwined but the ones on the right generally fruited earlier than the ones on the left. Perhaps there are two individuals whose ranges overlap here, but this could also be one individual that fruited slightly unevenly. The multicolored patch near the top is also interesting. The center fruited first, followed by the outer rim and then the middle doughnut. Does this mean there are three individuals in concentric rings, or is this one individual with a very strange fruiting pattern? I can’t be sure one way or the other from the map alone. For that, I’d need a DNA test that is more detailed than usual or a series of mating type studies (which of course is difficult because I. rimosa is mycorrhizal and doesn’t culture well).
Based on the maps, the patch of I. rimosa mushrooms in the center seems to be all the same individual. However, that patch seemed to be comprised of mushrooms with two ever so slightly different shades of brown. The darker ones were closer to the tree, while the lighter ones were farther away. At that point I had already counted half of the mushrooms and didn’t have a good method for measuring the different tones of brown. So although I suspect this area might contain more than one individual, I can’t verify that.
These are all the same species but clearly arise from separate mycelia. This is surprising because although I. rimosa takes up the largest area on the map, each individual mycelium is about the same size as the area marked off by any other given species. Is there a maximum size for individuals under my tree or is this a feature unique to I. rimosa? It would be interesting to map out the mushrooms under an older and larger willow oak to see how maximum individual size changes as trees age and under different tree species to see if host species has an impact on maximum individual size.
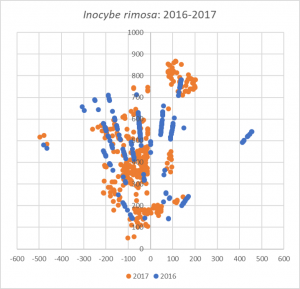 How does the 2017 map of I. rimosa compare to my 2016 data? It is difficult to read too much into this, since I improved upon my mapping methods throughout 2017. The old method didn’t give me very good definition far away from the tree, which is why the mushrooms appear in lines on the map. Still, you can see that in 2017, I. rimosa largely disappeared from three areas but significantly expanded its presence in the northwest and central areas of the map. Is this ebb and flow characteristic of mycorrhizal mushrooms? By continuing this project in 2018, I hope to begin to answer that question.
Russula pulerulenta
The most interesting mushroom that appeared in my yard was R. pulverulenta. In addition to its unusual morphology (why is it covered in granules reminiscent of the Mica Cap, Coprinus micaceus?), it displayed a bizarre fruiting pattern. Actually, it displayed almost no pattern to where it produced mushrooms. While most mushrooms produced fruiting bodies that were clustered near each other, R. pulverulenta 17 mushrooms haphazardly around the yard. There were two areas where the fungus produced small clusters of mushrooms: one was around the diversity hotspot at 4.84m and the other was in the mulch to the east northeast of the tree.
I have two hypotheses to explain this unusual fruiting pattern. First, it could be the remnants of a fairy circle that began years ago. If you connect all the R. pulverulenta points, they form a kind of lumpy oval. This could indicate that the mushroom began growing from the center of that oval years ago and slowly expanded its range to where it is today. During that time, other fungi like I. rimosa colonized the center of the oval and pushed out R. pulverulenta, making the Russula’s range seem disjointed.
Alternatively, R. pulverulenta could be a poor mycorrhizal partner. Most of its mushrooms appeared next to an area where another mushroom fruited or in mulch, where there are abundant nutrients. R. pulverulenta could be cheating in its mycorrhizal relationships by piggybacking onto other species or it could be supplementing the energy it gets from its host tree with energy from other sources (such as mulch, buried wood, or whatever is powering the hotspots).
Without doing a detailed analysis of the resources exchanged between R. pulverulenta and its host tree, it is impossible to say which of these situations is the most likely. Regardless, R. pulverulenta would be an interesting species to study in more detail.
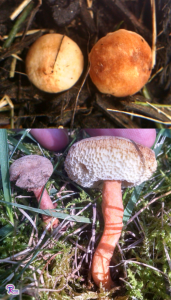
Gyroporus castaneus is a small bolete that appeared along the periphery of my yard’s potentially mycorrhizal area. It also routinely fruits in a mulch bed.
Gyroporus castaneus
G. castaneus, commonly called the “Chestnut Bolete” (see FFF#200), is a good edible mushroom, although it is small so you need a lot of it before you can cook it up. Unfortunately, I didn’t find a lot of this mushroom in my yard. Still, it was exciting to find an edible wild mushroom growing five paces from my door!
Even more exciting was its unusual fruiting pattern. Aside from two mushrooms growing at the 3.60m hotspot, all of its mushrooms appeared well beyond the tree’s dripline. The only mushroom I found growing farther away was Scleroderma bovista (Scleroderma species are well-known for their ability to form robust mycorrhizas in very poor soil conditions, so that was not very surprising), although that mushroom may be mycorrhizal with an oak tree further away in my neighbor’s yard. The first time I found G. castaneus in my yard – back in 2016 – was also unusual: three of the little boletes were growing right out of a mulch bed!
This unusual fruiting behavior made me wonder, “is G. castaneus saprobic?” I’m not the first to question the Chestnut Bolete’s ecological role; MushroomExpert.Com describes the mushroom as “usually reported as mycorrhizal… but possibly saprobic.” Based on my map, I conclude that G. castaneus is mycorrhizal. Although the mushroom fruits a surprisingly long distance away from the tree, it does so consistently in various types of ground cover (patchy grass, mossy grass, and mulch). If you connect the outermost clusters of G. castaneus mushrooms with lines, you begin to form a circle around the tree. This would only happen if the mushroom had a direct relationship with the tree, which strongly suggests that G. castaneus is mycorrhizal.
However, it seems likely that the mushroom doesn’t rely completely on its host tree for nourishment. Mushrooms known to be mycorrhizal, like I. rimosa and most of the russulas, fruit close to the base of the tree. Presumably, this is the most efficient location for the formation of mycorrhizas. The fact that G. castaneus fruits well outside this optimum zone and has appeared in mulch for two consecutive years suggests that it can take advantage of other sources of energy.
On the other hand, it could be acting more like a Scleroderma. Perhaps G. castaneus is very good at forming mycorrhizas in adverse conditions. Maybe the reason the Chestnut Bolete can form mycorrhizas in poor conditions is that it can take advantage of other energy sources. It could be that the same holds true for species of Scleroderma. This is all speculation at the moment; more intensive study of G. castaneus is required before we can be sure of its ecological role.
What Isn’t Included
As I already mentioned, I mapped only the mycorrhizal mushrooms. This left out hundreds of other mushrooms that appeared in my yard in 2017. Little brown mushrooms such as Tubaria heimalis and tiny inkcaps had to be left out, largely for my own sanity. Other mushrooms that didn’t make the cut included: Stropharia coronilla, the enormous Laetiporus persicinus, bird’s nest mushrooms, Auricularia auricula, Lycoperdon spp., and Leratiomyces ceres. I also didn’t map a strange little mushroom I found in the middle of my yard that looked like a miniature version of the Rooting Collybia.
A couple mycorrhizal mushrooms were also left out. I couldn’t include a tiny white coral that fruited all around the base of the tree because there were simply too many fruiting bodies to count in a reasonable amount of time. My yard probably had about 200 fruiting bodies and my neighbor’s yard contained at least double that. The coral was most likely Clavulina rugosa, which is presumably mycorrhizal. Like B. harrisonii, the mushrooms of C. rugosa grew intermingled with the Russula species. This indicates that they probably occupy a slightly different ecological niche than the russulas. If I can continue this project through the end of 2018, it might be interesting to include C. rugosa to see how it interacts with B. harrisonii. Both mushrooms’ areas overlap with the Russula areas, but how do they interact with each other?
Another coral fungus – a Ramaria species this time – appeared in the mulch behind my neighbor’s fence in August. Most Ramaria species are mycorrhizal, but I couldn’t identify or measure this one because it was too far behind the fence. Interestingly, this mushroom appeared only in the mulch. Thinking back on it, I’ve found a number of Ramaria mushrooms fruiting from mulch (presumably hardwood mulch) under trees in suburban yards. I encourage you all to keep track of your Ramaria sightings to help figure out what these mushrooms are doing in the suburbs ecologically.
I also considered mapping some of the small holes made by squirrels. The left side of the map is surprisingly devoid of mushrooms. This area is probably dominated by roots from arbuscular mycorrhizal trees, so this result is not very surprising. However, in late October I noticed that the squirrels had dug a lot of holes in the mushroom void and very few in the rest of the yard. Without the map, I wouldn’t have noticed this. With the map, I wondered what they were digging for. Were they searching for normal things like acorns? If so, why would the acorns be only in that one area and not under the rest of the oak tree? Perhaps they were instead searching for truffles. This would explain why no other mycorrhizal mushrooms appeared in the southwest corner of my yard: that area was already dominated by an ectomycorrhizal fungus that just didn’t produce any above-ground mushrooms. Unfortunately, it is very difficult to dig up truffles in grass because the roots severely impede your progress (and you end up with large unsightly holes in your yard). As a result, I couldn’t verify whether the squirrels were digging up truffles and therefore the holes were left out of my analysis. This is probably the biggest limitation in using suburbia to study mycorrhizal mushrooms; grass roots and a desire for an immaculate lawn mean there is no good way to study truffles.
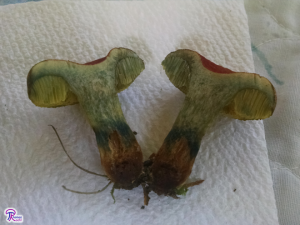
Boletus harrisonii is a small red-capped yellow-pored blue-staining bolete. It doesn’t pay much attention to other mushrooms’ areas, but I can’t explain why just based on my map.
Why Does This Matter?
My dataset is severely limited by the fact that it covers only 14 species (only five of which I could name) under a single tree for just one year. When you consider how many species of mushrooms and trees live in our area, this is barely a drop in the bucket. So how does this make a difference?
As far as I can tell, this is data that nobody has collected before. It’s so difficult to study how mycorrhizal mushrooms behave, since the mycelium lives underground and the mushrooms are difficult or impossible to cultivate. Simply mapping how far they fruit from their host tree gives us information about the conditions which encourage their growth.
These data also represent a first step in being able to assess the ecology of mycorrhizal mushrooms in forested areas. By learning what they do with single trees, it will be easier to look at a mushroom in a forest and estimate which tree(s) are its mycorrhizal partners. It will also help us learn more about how tree age influences mycorrhizal communities and how mycorrhizal partnerships change over time.
My dataset also identifies mushrooms that are doing something unexpected. These mushrooms would be particularly interesting to research further, especially since some – like G. castaneus or B. harrisonii – appear to be doing something different from most other mycorrhizal mushrooms. Understanding how these mushrooms behave differently would help us get a more complete picture of how mycorrhizas function and all the different variations on them.
Of course, the more data we have the easier it will be to reach these long-term goals. So, I encourage you to find a suitable tree and keep track of all the mushrooms you can find. Or, if you can’t do that, keep an eye out for some of the most interesting species and how they relate to trees. In particular, I’d like to gather more data about Gyroporus castaneus, Russula pulverulenta, and Ramaria spp.
Methods and Error
I didn’t use anything fancy for this study, just a long piece of string and a compass. For most of the year, I measured the distance of each mushroom from a point at the base of the tree and the compass reading from the mushroom to the tree. This gave me a distance and an angle that I could convert to x-y coordinates. The good thing about using the compass was that I had a stable reference point (magnetic north, which isn’t fully stable but is good enough for my relatively small plot). For mushrooms that were not directly in sight of the tree thanks to various obstacles, I measured out to a second point and then from that point to the mushroom.
Unfortunately, the compass wasn’t precise enough to give me good resolution between mushrooms more than a few meters from the tree (you can clearly see this in the 2016 I. rimosa data). So, I used a different method beginning in September. First, I measured the distance and compass reading from a second point. Then I measured a second piece of string and placed one end at the second point. To measure a mushroom, I measured from the tree base to the mushroom using the main string and then measured from the base of the tree to the point where the free end of the second string touched the main string. The first measurement gave me the mushroom’s distance while the latter measurement gave me the angle between the second point, the tree, and the mushroom. From these two numbers and the compass reading from the second point, I used trigonometry to plot the mushroom.
The string was marked off in 5cm intervals (giving an absolute error of ±2.5cm) and the compass was marked with 10 degree intervals (giving an absolute error of ±5 degrees). When you combine all the measurements, the error for some of the mushroom points (x and y coordinates) gets pretty high. However, because I measured from the base of the tree directly to most of the mushrooms, the error remains relatively low for calculations based on the distance from the tree. Distance from a tree can be compared from one area to the next, but x and y coordinates cannot. I chose my methods with this in mind, with the hope that I would one day compare data under my willow oak to data under a different tree.



![#011: Characteristics of Kingdom Fungi [Archived]](https://www.fungusfactfriday.com/wp-content/themes/hueman/assets/front/img/thumb-small-empty.png)
